Python · Data anonymisation · Network modelling · Statistics
Two projects where the work was the analysis itself: one on a school’s
own administrative records, one on a piece of my doctoral model rebuilt
from scratch. Both are on GitHub, code and all.
2026 · Python, pandas, Streamlit
Anonymising and analysing school records
Built from administrative records I worked with as school staff, in a
public school in Lisbon. The source data holds personal information about
minors, so the first thing I wrote was the anonymisation pipeline:
identity documents, tax and social-security numbers and emergency contacts
removed outright, names replaced by sequential pseudonyms, dates of birth
reduced to age, free-text health and dietary notes collapsed into broad
categories, and any small group folded into a larger one so nobody could be
identified indirectly. Only the anonymised output is versioned.
The analysis and an interactive dashboard went to the school’s
management. The results are not published here: the data belongs to the school.
Anonymisation pipeline, exploratory analysis, an interactive dashboard and a
slide deck for the school’s management. pandas, matplotlib, seaborn,
Plotly, Streamlit, python-pptx.
2026 · Python, NumPy, NetworkX
Rebuilding the T cell model in Python
Between 2015 and 2019 I asked what the microRNA miR-34c-5p actually does
inside an activated human CD4+ T cell. The answer was a logical network
model, built in GINsim, predicting what should happen downstream and
guiding the wet-lab work. The unfinished thesis then sat on a hard drive for six years.
I rebuilt a piece of it in Python: a parser for the thesis’s own notation,
a multi-valued evaluator, and an asynchronous simulator running 400
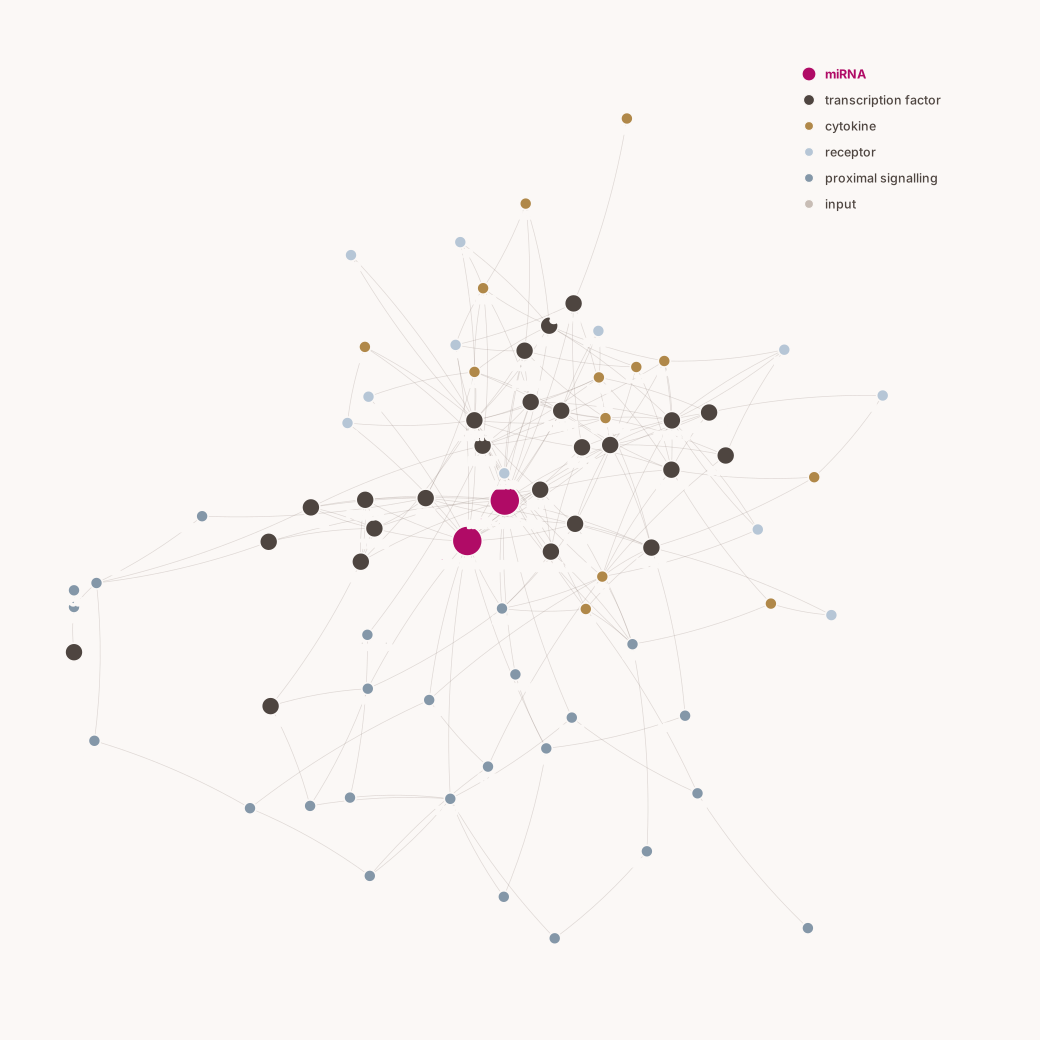
trajectories per condition. The 76 nodes and 89 logical formulas are
transcribed verbatim from Table 5 of the thesis draft, not reconstructed from memory.
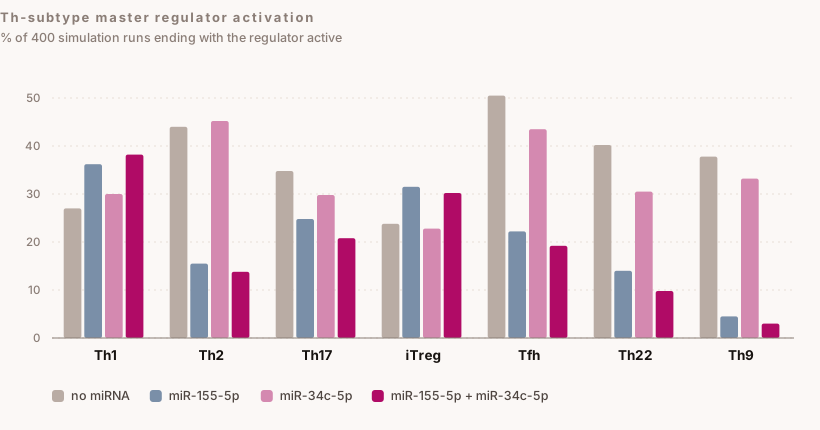
The digitised network: 76 nodes, colour-coded by role. The two miRNA nodes sit next to the transcription-factor core.Share of runs ending with each Th-subtype master regulator active, under four miRNA conditions.
miR-155-5p turns out to be the dominant driver: on its own it suppresses the
Th2, Tfh, Th22 and Th9 regulators while nudging Th1 and iTreg upward.
miR-34c-5p alone barely moves the baseline — but together the two suppress
that branch further than miR-155-5p does alone. The effect is cooperative,
not additive.
That is a related but not identical story to the 2019 discussion, which
leaned towards a Th17/iTreg shift. I would rather report the divergence than
tune the model until it agrees: the simulation method differs, and two
formulas in the original table are ambiguous as published and were evaluated
exactly as written. Both causes are documented in the repository.